Plot Shapely Polygon with Matplotlib

We can plot Shapely polygons by resorting to Geopandas plot() function, or directly, extracting the polygon's boundaries.
Plotting shapely polygons is something we will often do, either for its own sake when we need to create a map, of for visual debugging purposes when we are crafting an algorithm.
To illustrate this with a non-trivial example, let’s first create a polygon (which will have a hole in it) by computing the difference between two polygons, and plot the resulting one.
Using Geopandas GeoSeries.plot()
The simplest and more general way to plot a shapely polygon is to resort to Geopandas. More precisely, we will create a GeoSeries that holds our polygon.
There are many things we can do with a GeoSeries object (see the official docs). In particular, the GeoSeries class has a plot() function which relies on matplotlib.
from shapely.geometry import Polygon
import geopandas as gpd
import matplotlib.pyplot as plt

poly1 = Polygon( [(0, 0), (1,0), (1,1), (0,1) ] )
poly2 = Polygon( [(0.25, 0.25), (0.5,0.25), (0.5,0.5), (0.25,0.5) ] )
polydiff = poly1.difference(poly2)

myPoly = gpd.GeoSeries([polydiff])
myPoly.plot()
plt.show()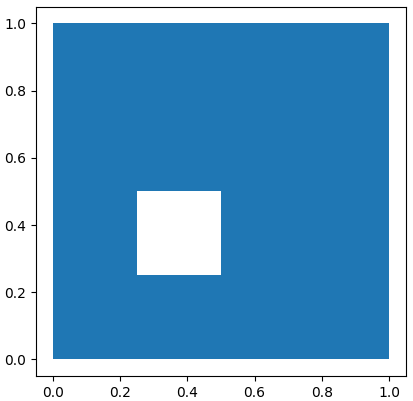
You can also plot the polygon’s boundary with
myPoly.boundary.plot()
plt.show()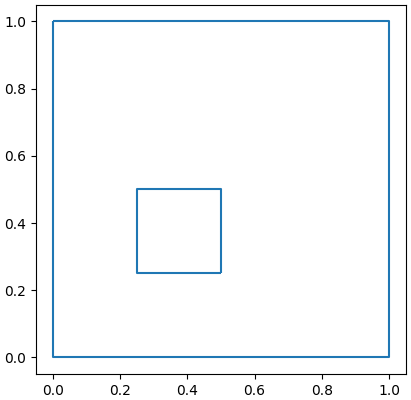
Manually extracting exterior and interior boundaries
An alternative method, in case we don’t want to rely on Geopandas, is to do this manually. We will need to extract both exterior and interior boudnaries (if the polygon has holes in it).
Each polygon object has an exterior ring, and zero or multiple interior rings. We can extract the coordinates of these rings and plot them as follows:
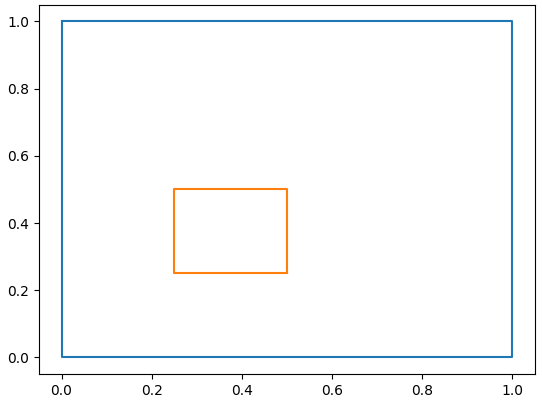
xe,ye = polydiff.exterior.xy
plt.plot(xe,ye)

for LinearRing in polydiff.interiors:
    xi,yi = LinearRing.xy
    plt.plot(xi,yi)

plt.show()