Polygon Gridding

We can split a polygon into equal-sized rectangles that form a grid, using Shapely.
In many applications, we have a potentially large polygon, and we need to split it into equal-sized squares, for subsequent parallel processing for example.
In this post, we’ll see how to create such squares. We will simply construct a square grid surrounding our polygon, and we will keep the intersecting squares.
Let’s begin writing a function that creates an enclosing grid. The code is pretty straightforward, relying on the bounds attribute of a polygon, and the linspace function in Numpy.
from shapely.geometry import Polygon
import numpy as np

def grid_bounds(geom, delta):
    minx, miny, maxx, maxy = geom.bounds
    nx = int((maxx - minx)/delta)
    ny = int((maxy - miny)/delta)
    gx, gy = np.linspace(minx,maxx,nx), np.linspace(miny,maxy,ny)
    grid = []
    for i in range(len(gx)-1):
        for j in range(len(gy)-1):
            poly_ij = Polygon([[gx[i],gy[j]],[gx[i],gy[j+1]],[gx[i+1],gy[j+1]],[gx[i+1],gy[j]]])
            grid.append( poly_ij )
    return grid
Now, we would like to keep only the squares that intersect our geometry. This can be implemented with a batch of intersection queries.
In order to do this efficiently, we will use a feature of Shapely, called prepared geometry.
To apply the intersects function to a list of squares, we then rely on Python’s filter built-in function (see official Python docs).
from shapely.prepared import prep

def partition(geom, delta):
    prepared_geom = prep(geom)
    grid = list(filter(prepared_geom.intersects, grid_bounds(geom, delta)))
    return grid
Now, it’s time to run a test and plot the results. In the example below we are using Geopandas just for it’s plotting function.
import geopandas as gpd
import matplotlib.pyplot as plt
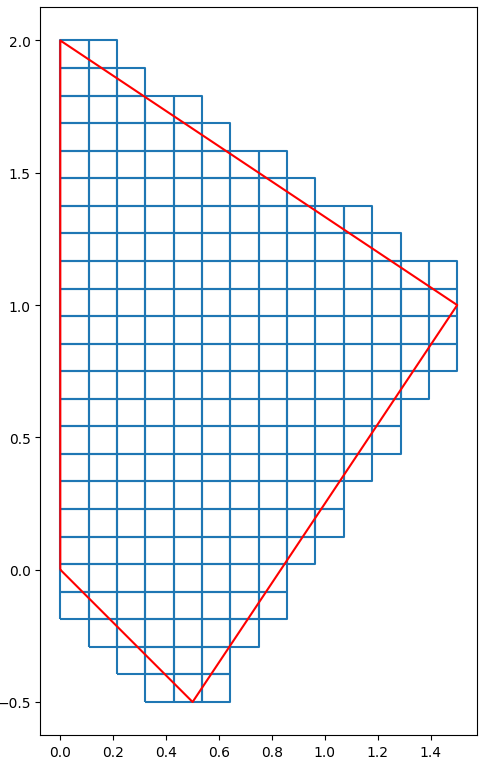
geom = Polygon([[0,0],[0,2],[1.5,1],[0.5,-0.5],[0,0]])
grid = partition(geom, 0.1)
fig, ax = plt.subplots(figsize=(15, 15))
gpd.GeoSeries(grid).boundary.plot(ax=ax)
gpd.GeoSeries([geom]).boundary.plot(ax=ax,color="red")
plt.show()