Axis Limits and Aspect Ratios

Last updated:
Control where and how data appears in a plot by setting limits and aspect ratios.
Axis limits
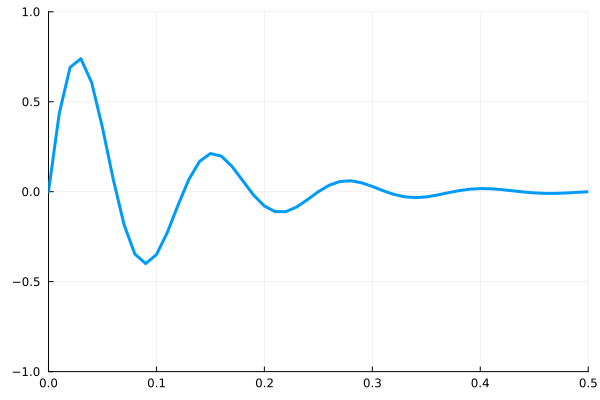
You can control where data appears in the axes by setting xlimits and ylimits.
using Plots
x = 0:0.01:1;
y = @. sin(8*2π*x)/exp(10*x);

plot(
    x,y,
    lw=3,
    label=false,
    ylimits=(-1,1),
    xlimits=(0,0.5)
    )
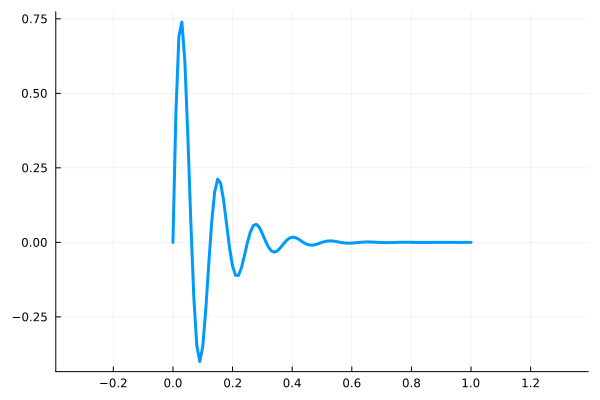
Equal Aspect Ratio
In order to get equally scaled axes with Plots.jl, we set the attribute
aspect_ratio = :equal (This is the Plots.jl equivalent to Matlab’s “axis equal”.)
using Plots
x = 0:0.01:1;
y = @. sin(8*2π*x)/exp(10*x);

plot(
    x,y,
    lw=3,
    label=false,
    aspect_ratio = :equal
    )