Legend Position

Last updated:
Set the legend locatin in a convenient position, including outside the plot.
Very often, the labels or each of our series end up being rendered in unconvenient locations. In order to fix this, we can set the legend attribute of our plot, as follows:
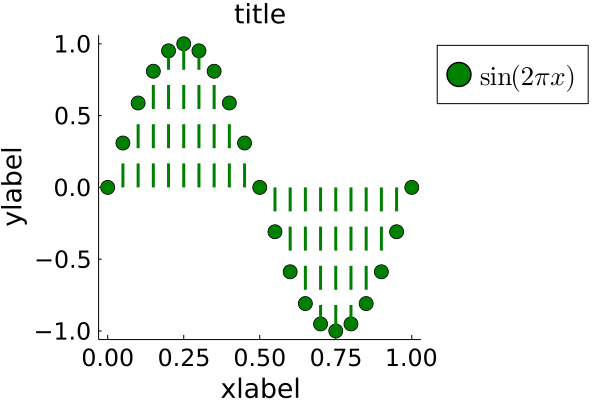
plot(x,y,legend=:outertopright)which, in conjuction with the other options we had set in our previous page, could end up looking like this:
Some possible values for the legend position are:
:right:left:top:bottom:topright:topleft:bottomright:bottomleft:outerright:outerleft:outertop:outerbottom:outertopright:outertopleft:outerbottomright:outerbottomleft