Lines Styles and Markers
Set the basic series attributes in order to choose between solid, dashed or dotted line plots, bar plots, or scatter plots
Dashed/dotted line plots and more
To begin styling our plot, we can begin with setting the following Series attributes:
| Series attributes | Type |
|---|---|
| seriestype | :path, :sticks, :scatter, :bar |
| linestyle | :solid, :dash, :dot, :dashdot, :dashdotdot |
| lw | Float |
| seriescolor | Color Type |
which will allow us to style the line.
For example, the code to produce a simple dashed line is
using Plots
x = 0:0.05:1;
y = sin.(2π*x);

plot(   x, y,
        seriestype=:path,
        linestyle=:dash
    )
while for a dotted line, we simply replace the linestyle=:dash with
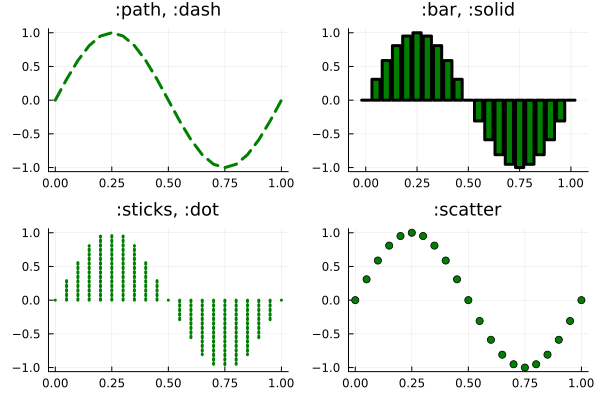
linestyle=:dotThis is how some different combinations of seriestype and linestyle look like.

Note that changing the seriestype of a column is equivalent to using commands such as scatter(x,y), bar(x,y), etc.
Custom Marker Shapes
Optionally, we can also add different kinds of marker shapes on top of the selected lines, with the following attributes:
| Series attributes | Type |
|---|---|
| marker | :d, :hex, |
| markersize | Float |
| markerstrokecolor | Color Type |
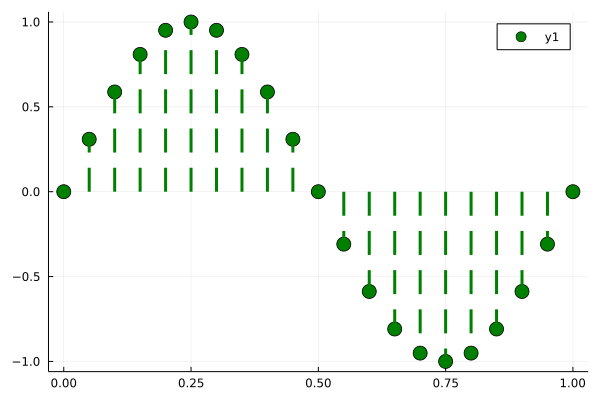
Let’s see a full example
using Plots
x = 0:0.05:1;
y = sin.(2π*x);

plot(   x, y,
        seriestype=:sticks,
        linestyle=:dash,
        lw = 3,
        seriescolor = :green,
        marker = :circle,
        markersize = 8,
        markercolor = :green,
        markerstrokecolor = :green,
    )
More succintly with line and marker tuples
When composing many different options to customize a plot, setting so many attributes one by one can become annoying.
More succintly, we can also use the equivalent syntax:
plot(   x, y,
        line=(3,:green,:dash,:sticks),
        marker=(:circle,8,:green,:green)
    )
Note that, remarkably, the line or marker tuples can contain their elements in different orders, so line=(:path,:dash,:green,2) or line=(2,:green,:dash,:path) will work as well.
Picking Colors
As for picking different colors for our lines or markers, the Color Type can stand for any symbol of the following list, like :darkblue, :firebrick, etc.
