Gridlines

Last updated:
Configure or get rid of the gridlines in a plot by setting the grid parameters.
Grid Lines
There are a few attributes related to the grid lines.
| Series attributes | Type |
|---|---|
| grid | boolean |
| gridlinewidth | Number |
| gridalpha | Number in [0,1] |
| gridstyle | :solid, :dash, :dot, :dashdot, :dashdotdot |
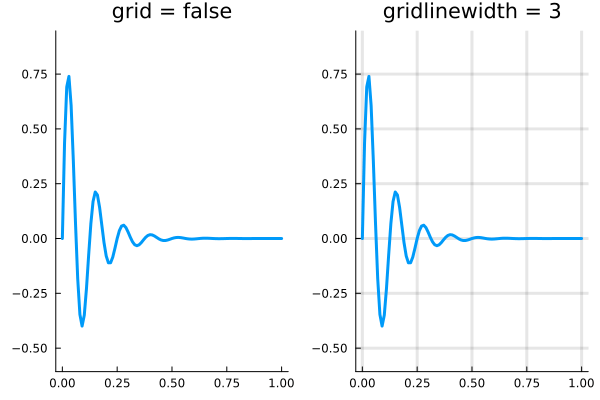
In particular, setting
grid=falsewill turn the grid lines off entirely, while something like In particular, setting
gridlinewidth = 3will make the grid lines thicker than the default value.
using Plots
x = 0:0.01:1;
y = @. sin(8*2π*x)/exp(10*x);

p1 = plot(
    x,y,
    lw=3,
    label=false,
    aspect_ratio = :equal,
    title="grid = false",
    grid=false
    )


p2 = plot(
    x,y,
    lw=3,
    label=false,
    aspect_ratio = :equal,
    title="gridlinewidth = 3",
    gridlinewidth=3
    )

plot(p1,p2,layout=(1,2))