Text and Font Sizes

Last updated:
Make your plot informative and readable with text and proper font sizes.
There are a number of typical places where we might want to include text within a figure. The title, labels for the x and y axes, or the legend for the line plots.
Some of the most useful Subplot Attributes to do this are:
| Subplot Attribute | Type |
|---|---|
| title | string |
| titlefontsize | Int |
| xlabel | string |
| ylabel | string |
| guidefontsize | Int |
| label | string |
| legendfontsize | Int |
| tickfontsize | Int |
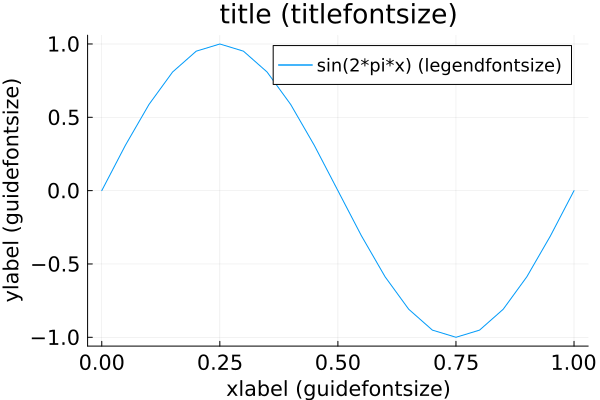
using Plots
x = 0:0.05:1;
y = sin.(2π*x);

plot(   x, y,
        title="title (titlefontsize)",
        xlabel="xlabel (guidefontsize)",
        ylabel="ylabel (guidefontsize)",
        label="sin(2*pi*x) (legendfontsize)",
        titlefontsize=18,
        guidefontsize=18,
        tickfontsize=16,
        legendfontsize=12,
        legend=:topright
    )
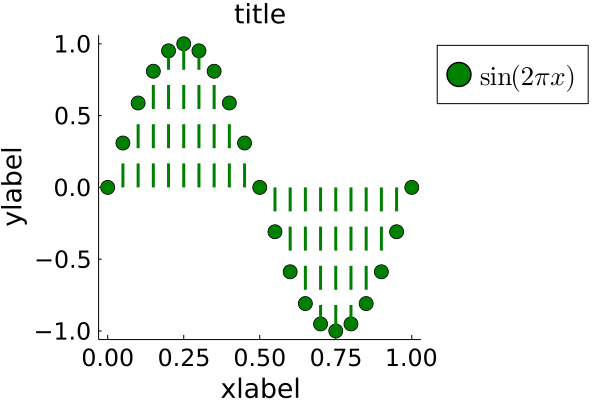
Using LaTeX
An other very useful package that can lead to fantastic quality plots is LaTeXStrings (mind the uppercases).
When we are using this package, simply preceding a string with an L, it will tell Plots.jl that we want to render it in Latex (e.g. L"\sin(2\pi x)")
label=L"\sin(2\pi x)",Let’s see how all this fits together:
using Plots
using LaTeXStrings

x = 0:0.05:1;
y = sin.(2π*x);
plot(   x, y,
        line=(3,:green,:dash,:sticks),
        marker=(:circle,8,:green,:green),
        title="title",
        xlabel="xlabel",
        ylabel="ylabel",
        label=L"\sin(2\pi x)",
        legend=:outertopright,
        titlefontsize=18,
        guidefontsize=18,
        tickfontsize=16,
        legendfontsize=18,
        grid=false
    )