Multiple Subplots

Last updated:
Multiple plots can be combined together into a single figure using layouts.
To compile multiple plots into a single figure, we need to adjust the layout.
There are many ways to do this, and arguably the simplest one is to create the plots sequentially, as follows:
using Plots
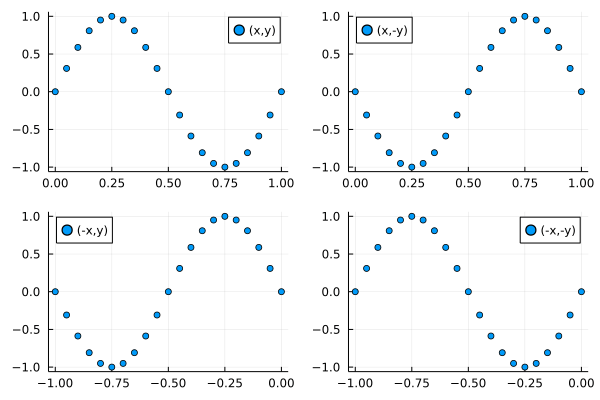
p1 = scatter(x, y, label="(x,y)")
p2 = scatter(x, -y, label="(x,-y)", legend=:topleft)
p3 = scatter(-x, y, label="(-x,y)", legend=:topleft)
p4 = scatter(-x, -y, label="(-x,-y)") and then combining them into a single plot with
plot(p1,p2,p3,p4, layout = (2,2) )This is the result: