Plots.jl Quick Reference

Quick reference guide on how to get started with Plots.jl
There are many visualization libraries to choose from in the Julia ecosystem (see below on this page). Arguably, the Plots.jl library is the standard plotting tool in the Julia ecosystem. It in turn provides a single API to access multiple “backends”, which include:
| Backend | Documentation |
|---|---|
| Matplotlib (Pyplot) | Pyplot |
| Plotly | Plotly |
| GR | GR |
To select one of these different backends, we simply call the corresponding command. For example, to load Plots.jl and use the GR backend (which is the default), we would do:
using Plots
gr()
You can check the official documentation of Plots.jl here.
While the Tutorial section of the documentation can help you get started, I found it a little overwheliming at first sight. Over time, I ended up compiling a list of the properties I most frequently use, which I share in this page.
Simple Plots with Plots.jl and GR
The simplest kind of plots are line plots, which can be produced given at least two vectors x and y.
using Plots
gr()

x = 0:0.05:1;
y = sin.(2π*x);
plot(x,y)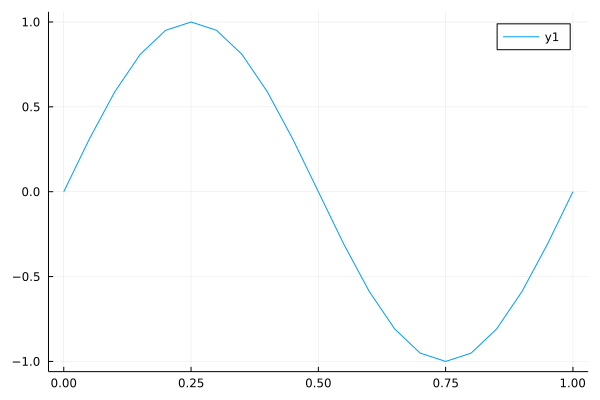
Other Visualization Packages
There are multiple plotting packages for Julia worth checking:
| Package | Description | Examples | Tutorial |
|---|---|---|---|
| StatsPlots.jl | A drop-in replacement for Plots.jl that contains specialized statistical plotting functionalities. | StatsPlots.jl repository | Plots.jl docs |
| Makie.jl | A high-performance plotting ecosystem with OpenGL, Cairo and WebGL backends. It’s great for publication-quality plotting, but can be a little bit slow to load and use | Docs | |
| VegaLite | A Julia wrapper for the Vega-Lite library. Great for interactive graphics. | Docs. | |
| Gadfly | Based on the R package gglot2, very well suited for statistics and machine learning. | Docs |
Detailed documentation can be found in each package, and in the referenced tutorials and examples pages.